

Financial Charts
Financial Performance Metrics
Explore our financial charts to gain insights into revenue growth, profitability, and investment returns.
4%
INR 766 Cr
Total Revenue
Q4 FY2026
9%
INR 86 Cr
EBITDA
Margin | 11.09%
Q4 FY2026
5%
INR 55 Cr
PAT
Margin | 7.1%
Q4 FY2026
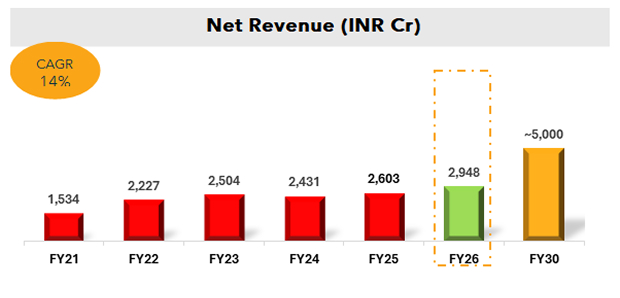
13%
INR 2948 Cr
Total Revenue
FY2026
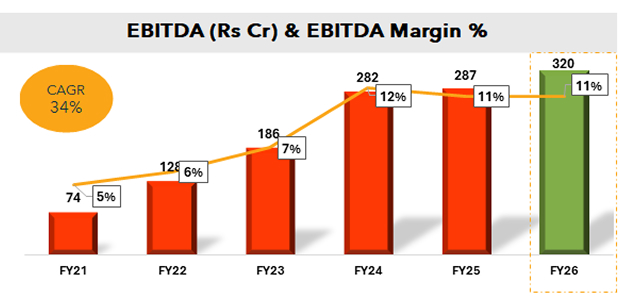
12%
INR 320 Cr
EBITDA
Margin | 10.74%
FY2026
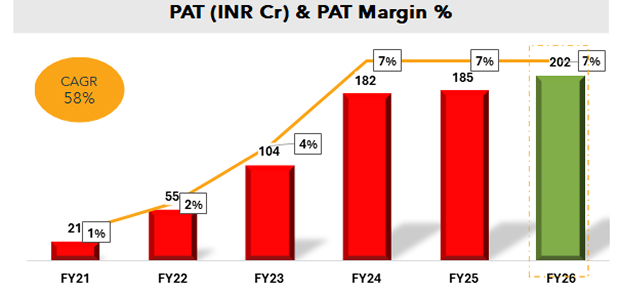
9%
INR 202 Cr
PAT
Margin | 6.8%
FY2026

Credit Ratings
Rating Agency
Investor Categories
Investor Resources
Access valuable resources tailored for investors, including financial reports, presentations, and governance information.

Corporate Action History with Record Date
Explore Ddev Plastiks corporate action history, including dividend declarations, stock splits, and other significant events, along with their respective record dates for investor reference
View the records